
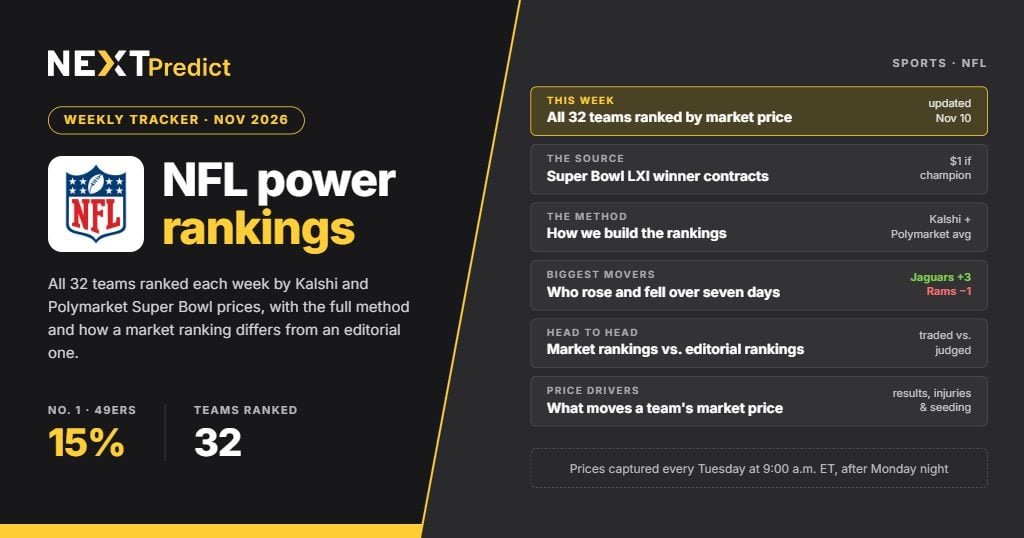
Kalshi and Polymarket price NFL teams through NFL event contracts settling at $1 or nothing. Those prices, quoted from 1 to 99 cents, read as implied probabilities for game, playoff and championship outcomes. Sports event contracts accounted for $10.44 billion of Kalshi’s $17.91 billion volume in May 2026, with sports and politics remaining the two biggest categories at both exchanges.
This page sets out NFL power rankings for all 32 teams based on what Kalshi and Polymarket prices imply. It shows exactly how the ranking is built and how a market-based ranking differs from an editorial power ranking.
This Week’s NFL Power Rankings by Market Price
| Rank | Team | Market-implied probability | Change from last week | Source markets |
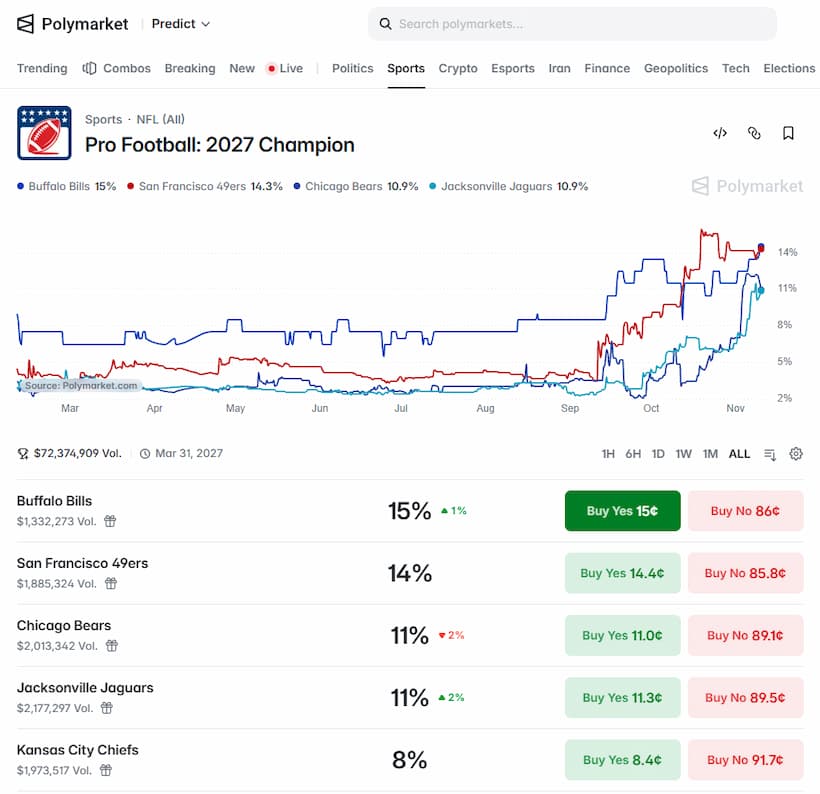
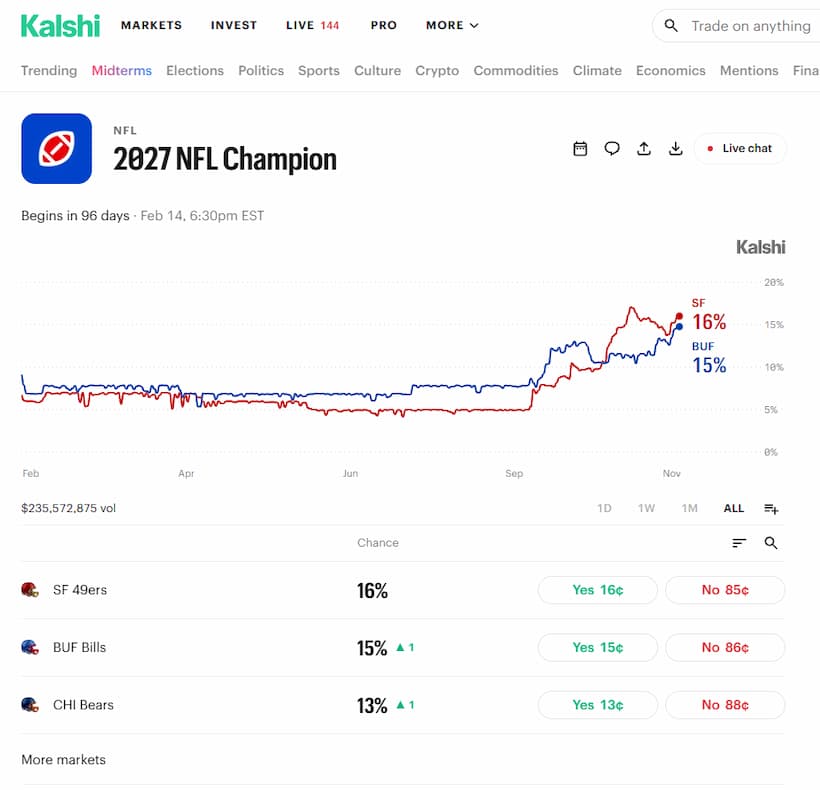
| 1 | San Francisco 49ers | 15% | +1 pts | Kalshi 15.5¢, Polymarket 14.4¢ |
| 2 | Buffalo Bills | 14% | +1 pts | Kalshi 14¢, Polymarket 15¢ |
| 3 | Chicago Bears | 12% | +2 pts | Kalshi 12.5¢, Polymarket 11¢ |
| 4 | Jacksonville Jaguars | 11% | +3 pts | Kalshi 10.5¢, Polymarket 10.6¢ |
| 5 | Kansas City Chiefs | 7.8% | No change | Kalshi 7.5¢, Polymarket 8.4¢ |
| 6 | Los Angeles Rams | 6.3% | -1 pts | Kalshi 5.5¢, Polymarket 7¢ |
| 7 | Cincinnati Bengals | 6.2% | +1 pts | Kalshi 6.5¢, Polymarket 5.9¢ |
| 8 | Denver Broncos | 5.3% | +1 pts | Kalshi 5.5¢, Polymarket 5.1¢ |
| 9 | Detroit Lions | 4.5% | No change | Kalshi 4.5¢, Polymarket 4.2¢ |
| 10 | Seattle Seahawks | 4.3% | -1 pts | Kalshi 4.5¢, Polymarket 3.8¢ |
| 11 | Green Bay Packers | 3.5% | +1 pts | Kalshi 3.5¢, Polymarket 3.2¢ |
| 12 | Minnesota Vikings | 2.6% | -1 pts | Kalshi 2.5¢, Polymarket 2.8¢ |
| 13 | New England Patriots | 2.5% | -1 pts | Kalshi 2.5¢, Polymarket 2¢ |
| 14 | Houston Texans | 2.4% | +1 pts | Kalshi 2.5¢, Polymarket 2.2¢ |
| 15 | Pittsburgh Steelers | 2% | +1 pts | Kalshi 2.5¢, Polymarket 2.1¢ |
| 16 | New York Giants | 1.5% | No change | Kalshi 1.5¢, Polymarket 1.5¢ |
| 17 | Dallas Cowboys | 1.4% | No change | Kalshi 1.5¢, Polymarket 1.3¢ |
| 18 | Los Angeles Chargers | 1% | No change | Kalshi 1¢, Polymarket 1¢ |
| 19 | Carolina Panthers | 1% | No change | Kalshi 1¢, Polymarket 1¢ |
| 20 | Tampa Bay Buccaneers | 1% | No change | Kalshi 1¢, Polymarket 1¢ |
| 21 | New York Jets | 1% | No change | Kalshi 1¢, Polymarket 1¢ |
| 22 | Cleveland Browns | 1% | No change | Kalshi 1¢, Polymarket 1¢ |
| 23 | Baltimore Ravens | 0.9% | No change | Kalshi 1¢, Polymarket 1¢ |
| 24 | New Orleans Saints | 0.8% | No change | Kalshi 1¢, Polymarket 1¢ |
| 25 | Atlanta Falcons | 0.8% | No change | Kalshi 1¢, Polymarket 1¢ |
| 26 | Washington Commanders | 0.8% | No change | Kalshi 1¢, Polymarket 1¢ |
| 27 | Las Vegas Raiders | 0.7% | No change | Kalshi 1¢, Polymarket 1¢ |
| 28 | Philadelphia Eagles | 0.7% | No change | Kalshi 1¢, Polymarket 1¢ |
| 29 | Arizona Cardinals | 0.7% | No change | Kalshi 1¢, Polymarket 1¢ |
| 30 | Miami Dolphins | 0.7% | No change | Kalshi 1¢, Polymarket 1¢ |
| 31 | Tennessee Titans | 0.7% | No change | Kalshi 1¢, Polymarket 1¢ |
| 32 | Indianapolis Colts | 0.5% | No change | Kalshi 1¢, Polymarket 1¢ |
NFL power rankings based on Super Bowl 2027 odds
Last updated: November 10, 2026. NEXTPredict does not operate a licensed real-time NFL power rankings odds feed. Prices are snapshots from third-party data and might differ from live exchange prices.
These NFL power rankings order every team by its price to win Super Bowl LXI on Kalshi and Polymarket. Each probability is the average of the two exchanges’ prices, rounded to one decimal place. The change column shows the move over the previous seven days, as recorded by DeFi Rate.
Our guide to Super Bowl event contracts explains how these championship contracts settle. The ranking reflects market prices only and carries no editorial judgment on any team.
How We Build the Rankings
Each ranking uses one event contract per team which is the market on which team will win Super Bowl LXI. NEXTPredict takes that contract’s price on Kalshi and on Polymarket’s international platform. Both settle at $1 if the team wins the title and nothing if it does not.
For each team, we use the midpoint between the best bid and best ask on each platform. Where a platform shows no two-sided quote, we use its last traded price instead. We then take a simple average of the two platform prices and round it to one decimal place. Our guide to how event contracts are priced explains why a price reads as a probability.
Prices are captured each Tuesday at 9:00 a.m. ET, after the week’s Monday night game. The change column compares that figure with the previous Tuesday’s capture.
When a team has a price on only one platform, we rank it on that price alone and mark it with an asterisk. When two teams share the same average, the team with the higher single-platform price ranks first. If they remain level, the teams are listed alphabetically.
Exchange prices include spreads, so the 32 probabilities will not sum to exactly 100 percent. We do not adjust for that gap, and the ranking reflects market prices without editorial input.
Biggest Movers This Week
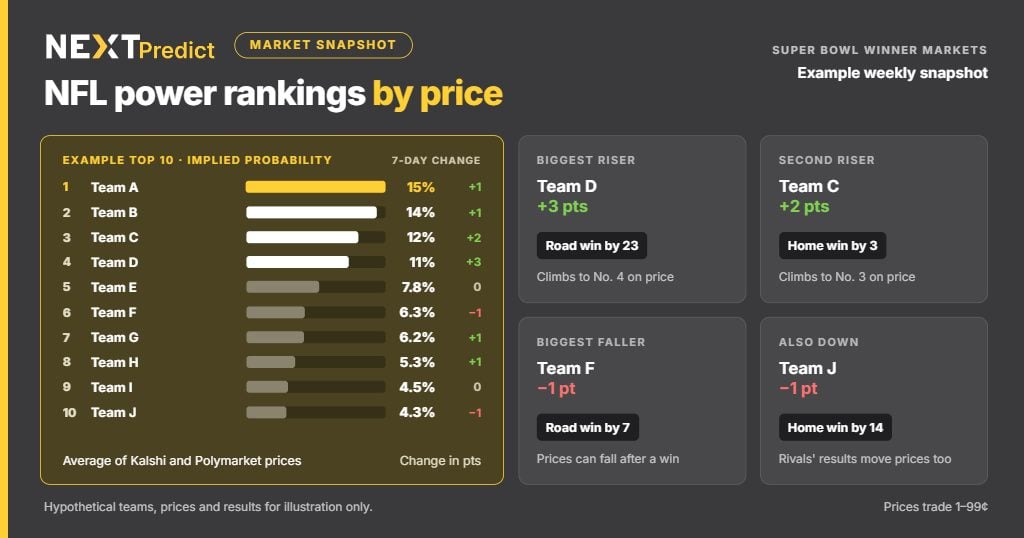
Each week, this section will cover the two biggest positive movers and the two biggest fallers. The largest seven-day moves among the 32 NFL power rankings teams came from Jacksonville and Chicago, following wins against Baltimore and Tampa Bay respectively.
Although both Los Angeles and Seattle won their respective Week 9 ties against Washington and Arizona, both moved down a point.
| Team | Change | Market-implied probability | Week 9 result |
| Jacksonville Jaguars | +3 pts | 10.6% | Won 33-10 at Baltimore Ravens |
| Chicago Bears | +2 pts | 11.8% | Won 27-24 against Tampa Bay Buccaneers |
| Los Angeles Rams | -1 pts | 6.3% | Won 20-13 at Washington Commanders |
| Seattle Seahawks | -1 pts | 4.2% | Won 17-3 against Arizona Cardinals |
Each result records what happened during the week and does not explain the price move. A team’s price also responds to other teams’ results, injuries and changes in the playoff picture. The table contains no speculation, and it names a cause only when a cited source supports it.
Market Rankings vs. Editorial Power Rankings
A market ranking orders teams by what traders pay for a single outcome on winning the Super Bowl. An editorial power ranking orders teams by a writer’s or panel’s assessment of current strength. The two measure different things, so the same team might sit in different places on each list.
Championship prices reflect traders’ view of the whole route to the title, including remaining schedule and playoff seeding. A team in a weaker division might rank higher on price than its record alone suggests. An editorial ranking often weighs recent form more heavily and changes when its authors reassess a team.
Market prices also update as trading occurs, while editorial rankings typically publish once a week. This page captures prices at a fixed weekly time, so the two formats follow a similar schedule.
Prices on long-shot teams often rest on thin trading, as our guide to prediction market liquidity explains. Our explainer on what is a prediction market covers how traders set these prices.
What Moves a Team’s Market Price
Game results move championship prices because each win or loss changes a team’s route to the playoffs. Quarterback availability and other injuries also move prices, often after teams release official injury reports. The remaining schedule and the wider playoff picture feed into prices too, including division races and seeding. Prices also respond to results elsewhere, since another team’s loss improves a rival’s position in the NFL power rankings.
Price moves on lower-ranked teams often rest on few trades, so a single order shifts the figure further. This is why thin markets behave this way when liquidity is low and trading volume isn’t as prominent as on the higher-ranked teams.
The NFL asked prediction market operators in September 2026 to remove contracts it called “objectionable,” with the letter specifically targeted player-action, injury, broadcast-mention and officiating markets rather than seeking a blanket ban on NFL contracts.
This page ranks teams on prices only and draws no conclusion about which driver moved any single price.
Conclusion
This ranking orders all 32 teams by their Super Bowl LXI prices on Kalshi and Polymarket. It updates weekly on a fixed schedule and reflects market prices, not editorial judgment. For a comparison of the two exchanges’ structures and fees, see our Kalshi vs Polymarket guide.
Our NFL hub and Super Bowl page, both linked above, cover game and championship contracts in more detail.
Last updated: November 10, 2026.
Frequently Asked Questions
What are NFL power rankings by market odds?
These NFL power rankings order all 32 teams weekly by their Super Bowl LXI prices on Kalshi and Polymarket. Each contract pays $1 if the team wins the title and nothing if it does not. The ranking uses those prices instead of a writer’s or panel’s view.
How are the market-based rankings calculated?
NEXTPredict takes each platform’s bid-ask midpoint, or its last trade where no two-sided quote exists. It averages the Kalshi and Polymarket figures, rounds to one decimal place and breaks ties by the higher single-platform price.
How often are the rankings updated?
The rankings update once a week. Prices are captured each Tuesday at 9:00 a.m. ET, so the snapshot includes Monday Night Football. The change column compares each team’s figure with the previous Tuesday’s capture.
How do market rankings differ from editorial power rankings?
A market ranking reflects what traders pay for one outcome, a Super Bowl title. An editorial power ranking reflects a writer’s or panel’s assessment of a team’s current strength. The two measure different things, so a team’s position often differs between them.
Where do the prices come from?
The prices come from each exchange’s market on the Super Bowl LXI winner. On Kalshi, that is the Pro Football Champion market. On Polymarket, it is the Super Bowl Champion 2027 market on the international platform.
Resources: DeFi Rate | Kalshi | Polymarket | NFL